
Nat-Gas? Watch-out!
Nat-Gas

Natural gas is down more than 54% from its February 2026 highs, sitting at $2.59 as I write this, and honestly, at these levels, it starts to look interesting.
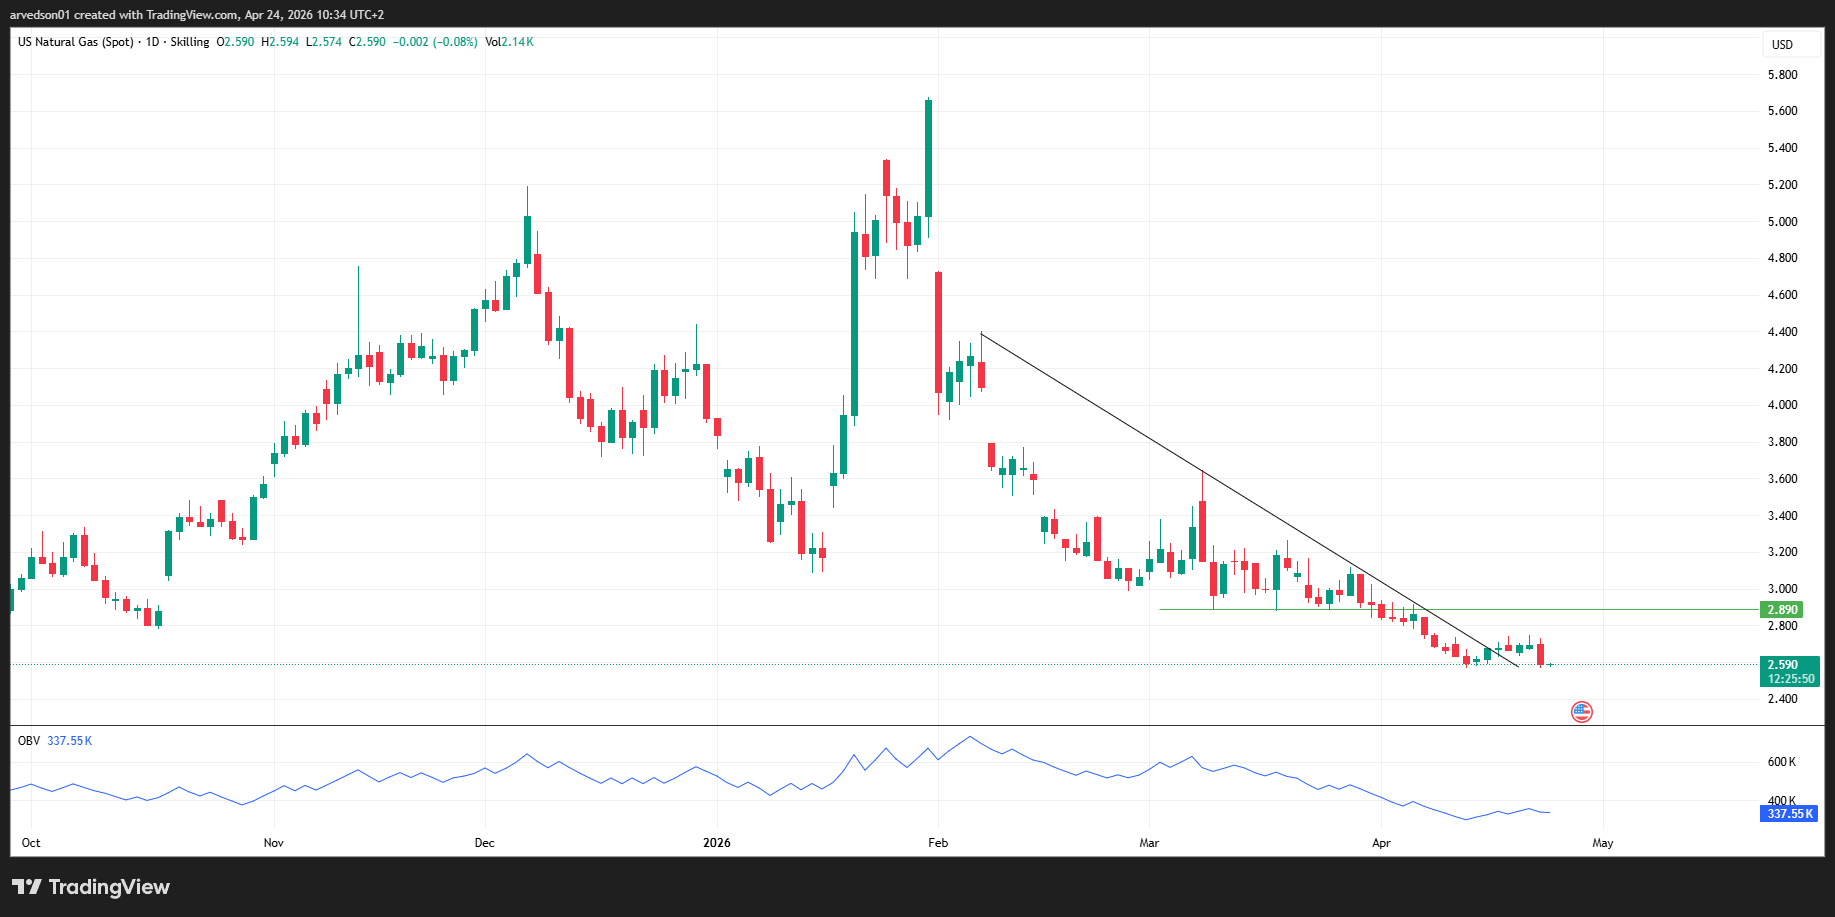
The setup was there. A clean descending trendline containing every rally since the $5.70 peak, a solid horizontal level at $2.89 that had held as support through most of March and April, and for a moment, it looked like the market was finally setting up for something big. The kind of run that makes you feel like a genius. Longs piled in, people were probably already writing their victory tweets, and then natgas did what natgas does: flushed everyone out, broke below $2.89, and left a whole crowd of very optimistic people crying alone in the corner.
I know that corner well. I was sitting there myself two days ago after shorting AMD, and I will write about that one later this week if you want to come join me in the corner. There is plenty of room.
The OBV (basically a tracker that tells you whether more real money is flowing in or out beneath the surface) is sitting at 337K and still trending down, which means buyers are not quietly loading up here yet. That is the honest read: the structure is getting interesting, but the volume is not confirming anything yet.
So the question is simple. Was this flush the one that finally clears the deck for a real move up, or are we just one more leg away from $2.40?
That is what we are going to figure out together.
This is the 30-minute chart, and this is where things get interesting.
What I was watching for was a breakout from that converging structure you can see on the left side of the chart, two trendlines squeezing price into a point, and I wanted confirmation before touching anything. A couple of days of watching, and then the breakout happened exactly where it should have. I entered confidently, which is a feeling I do not take for granted.
The Fibonacci levels (basically mathematical price targets that traders use to estimate how far a move is likely to go, based on the size of the previous swing) were laid out clearly: $2.604 as the base, $2.630 as the first target, $2.647 in the middle, and $2.673 as the 1.618 extension, which is the level where a move tends to either exhaust or accelerate.
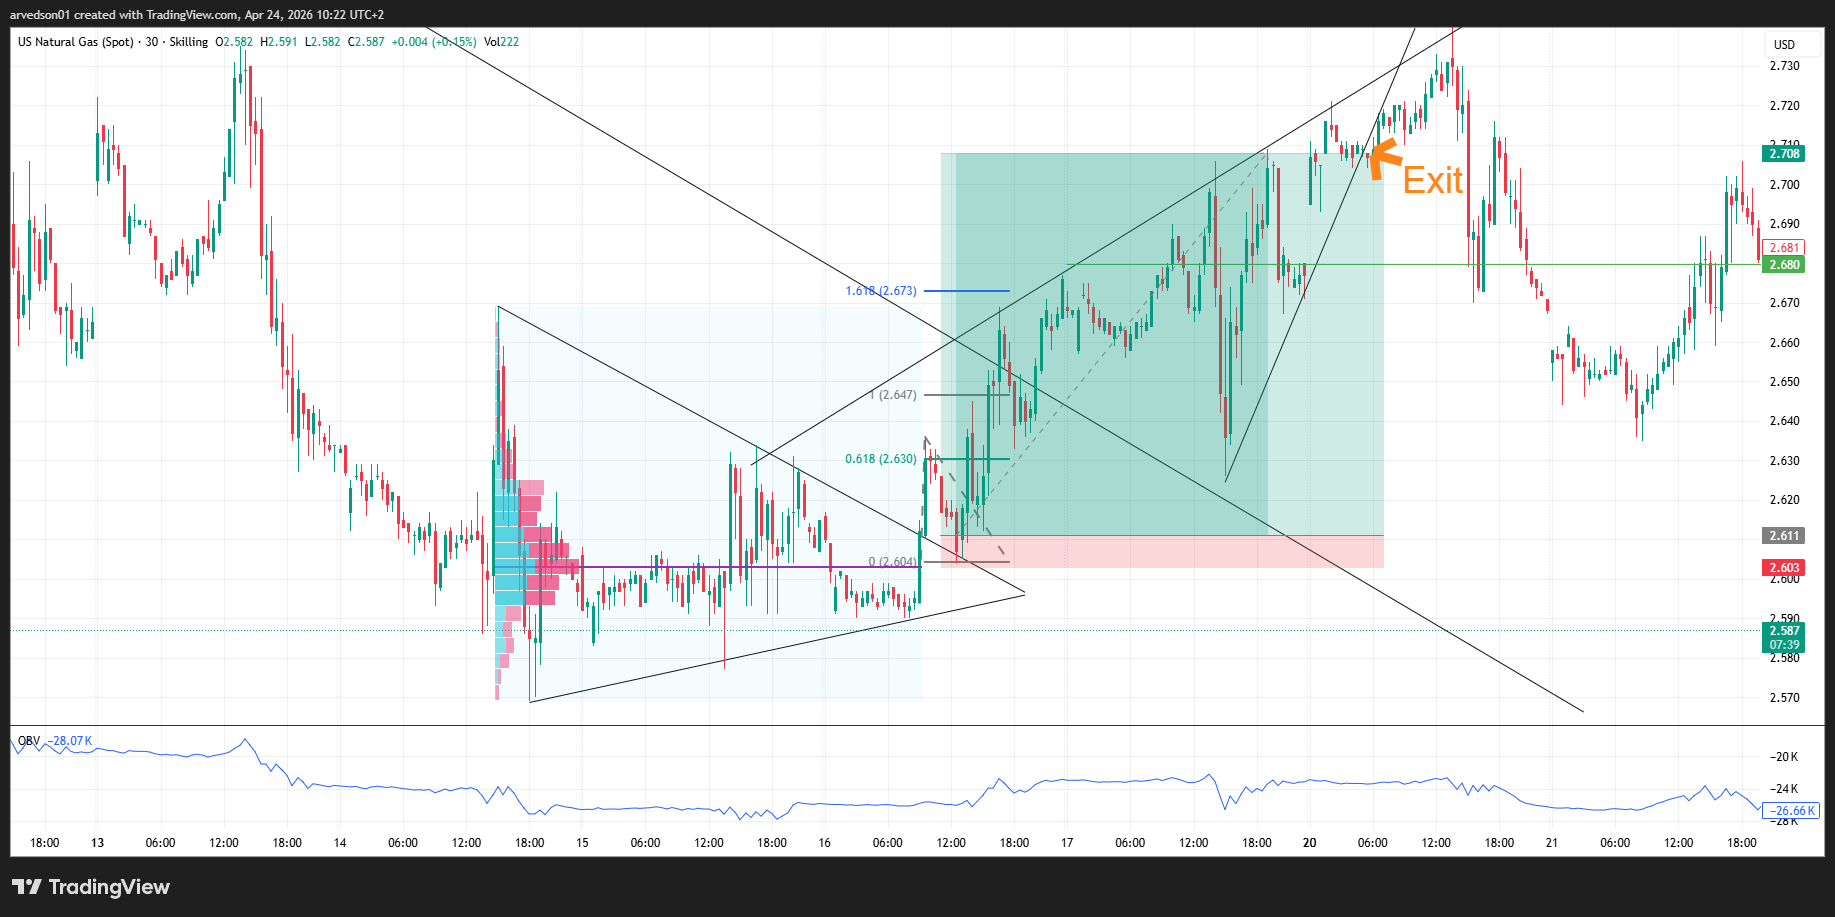
I let the trade run. Price climbed into the rising wedge, reached the lower boundary of that structure, and I felt the shift before it happened. Rising wedges almost always resolve to the downside, so I closed the position, took the profit, and watched the market continue higher without me.
That specific feeling, watching a trade you just closed keep going in your direction, is genuinely one of the worst things about this job. You know intellectually that you made the right call. You also want to throw your keyboard out the window.
Then the upper trendline of the wedge got hit, and the market fell hard, exactly like the structure suggested it would. I watched that happen too, wanted to buy the bounce at the bottom, and missed it because I was having fun at the beach with my family.
This is where the story gets personal.
The wedge played out exactly as expected, price reversed hard from the upper trendline, and I was flat, profitable, and genuinely happy with how it went. I was at the beach celebrating my wife’s birthday, checking the charts on my phone between conversations like the person I am, and that is when I watched natgas climb into FOMO Zone 1.
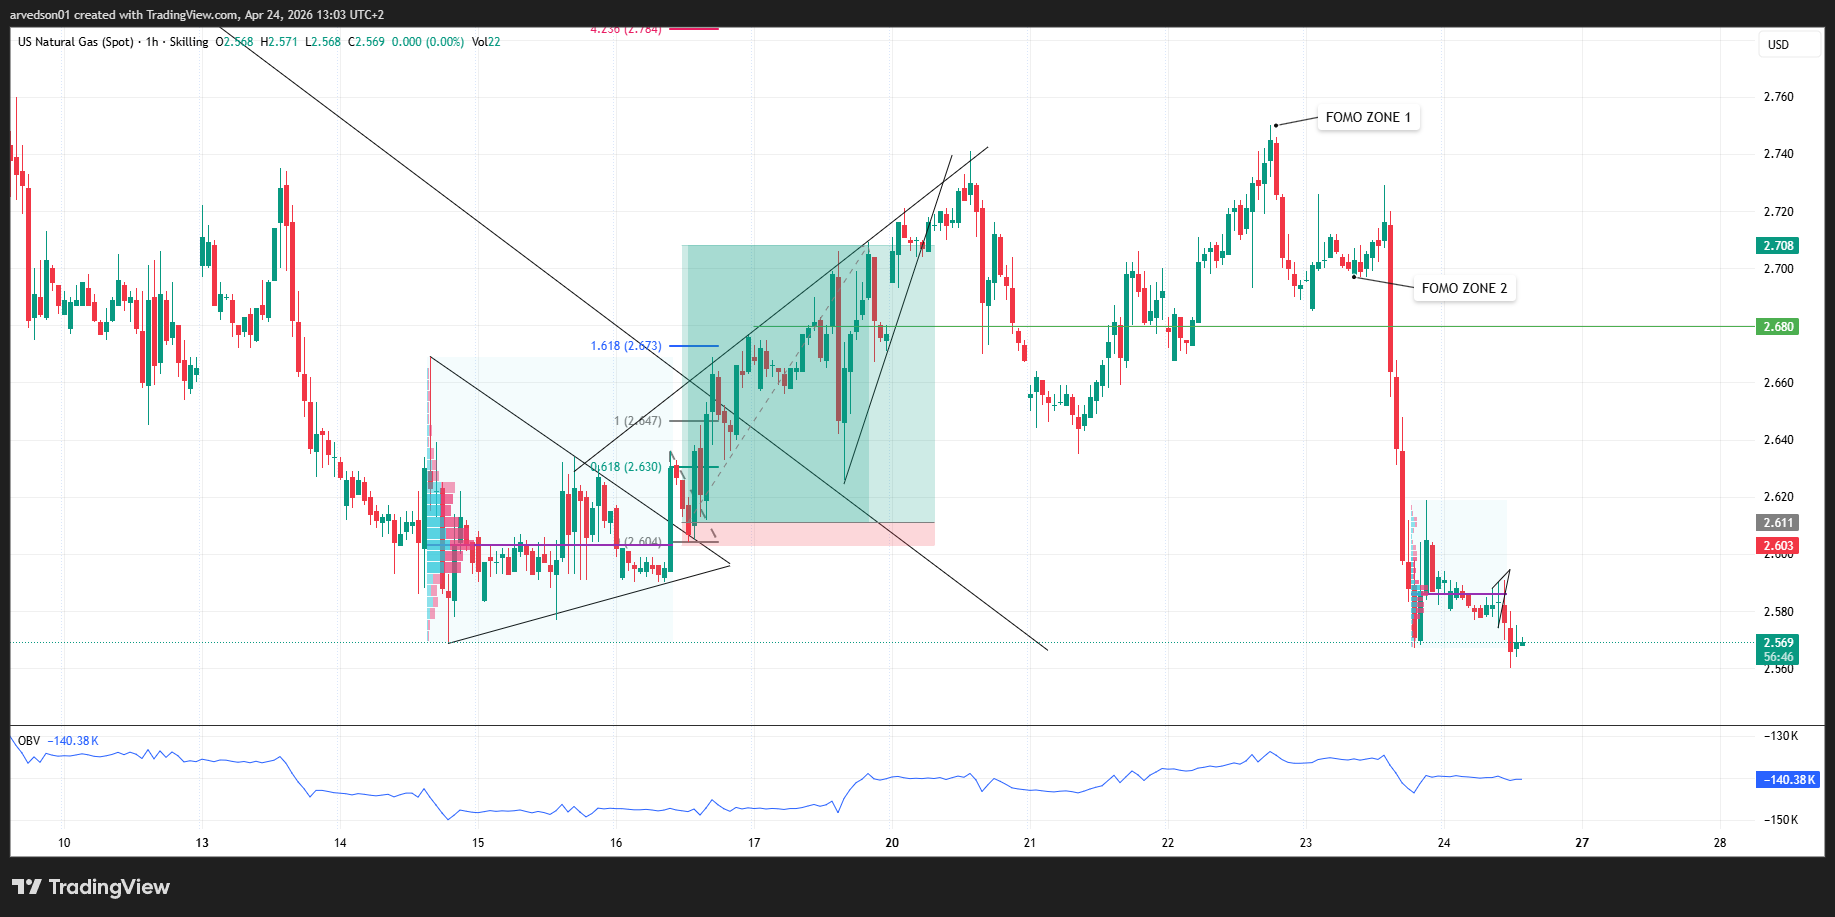
Price pushing toward $2.75, without me, while I was supposed to be present and enjoying the day. That specific kind of anger, the anger at yourself for being right and still missing the continuation, is one of the most dangerous places you can be mentally as a trader. I was sitting there thinking about re-entering with a position twice the size of the original. Not because the setup had improved. Because I was watching a move happen without me and my ego did not like it.
I did not enter. I put my phone down and went back to the birthday.
The next morning, around 8am, I was back at the charts and found myself staring at FOMO Zone 2. Price had pulled back to $2.680, the level looked clean, and that little voice came back immediately: you can still get in, bigger than before, right here. The justification was already building. But something felt off. The OBV (a tracker that tells you whether real buying pressure is accumulating beneath the surface) was sitting at -140K and not recovering. Those sharp drops were starting to look less like shakeouts and more like distribution, the kind of selling where the market lets price bounce just enough to give late longs a reason to buy before dumping again.
I felt anxious in a way that my better setups never make me feel. I have learned, slowly and at some cost, that anxiety before a trade is not excitement. It is your body telling you something your brain is still negotiating with.
I went to the gym instead.
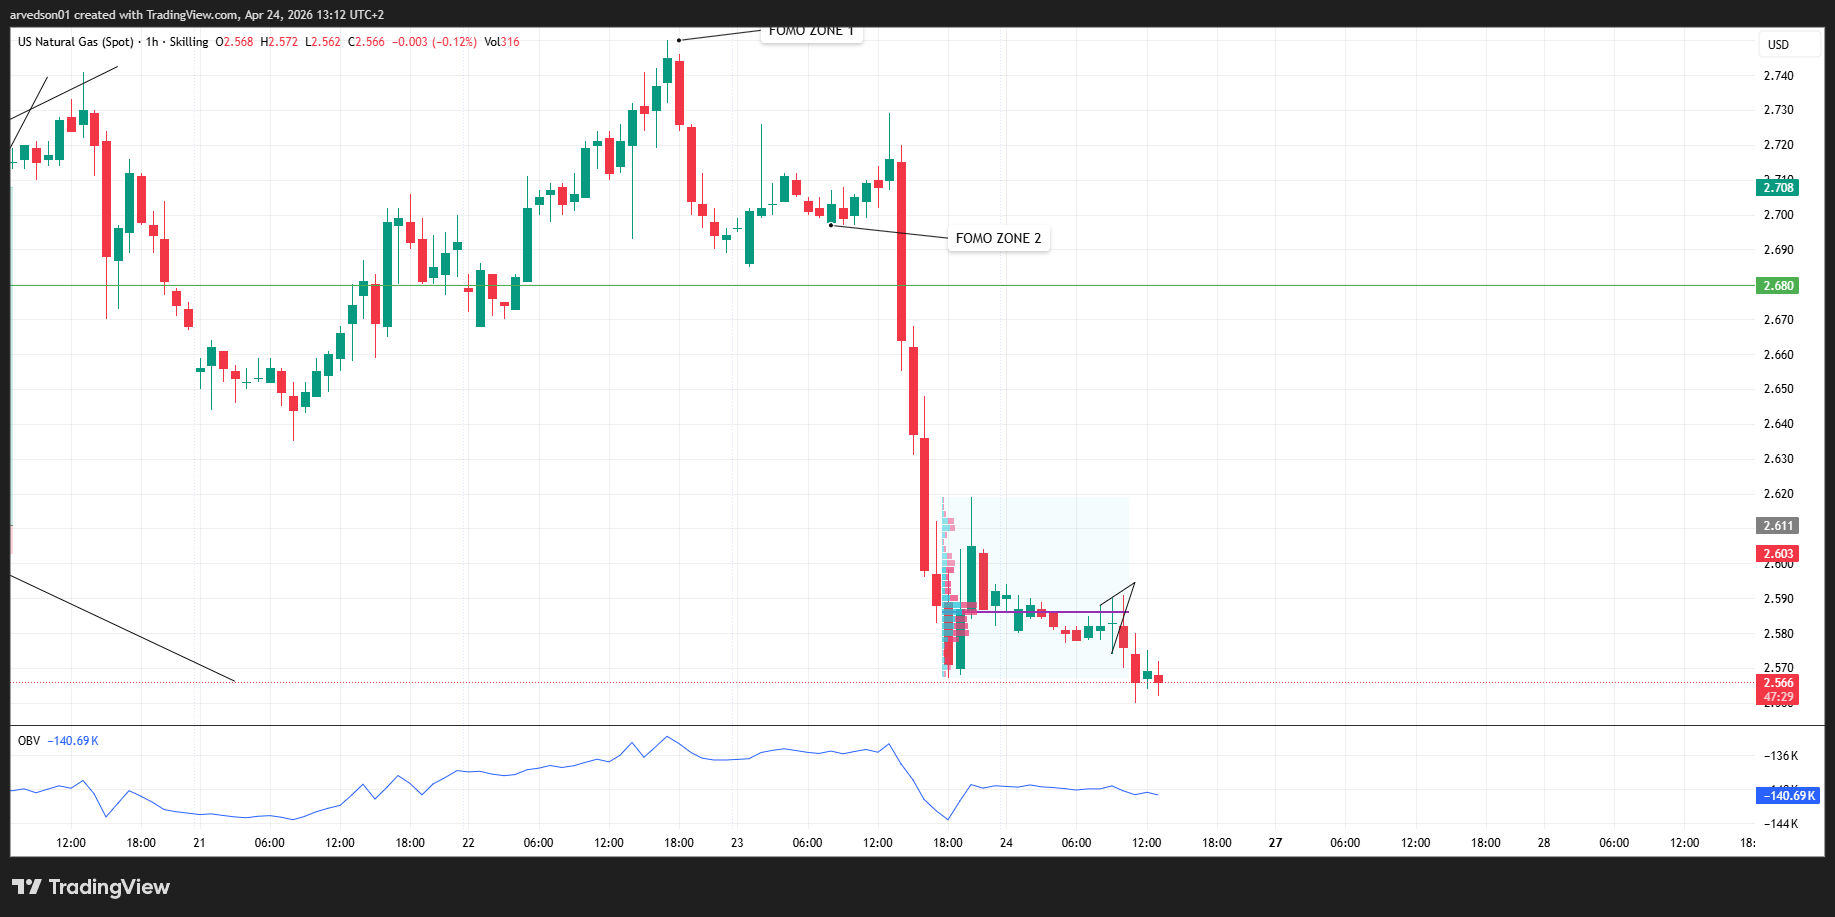
I came back to a vertical red candle. You can see it at the center of the chart. April 24, straight down from $2.68 to $2.57 in a matter of hours, with OBV confirming every tick of it.
The gym was the right call.
As I was putting this article together this morning, I pulled up the 1-minute chart just to watch live price action while I wrote, and there it was again. Another rising wedge forming in real time, same structure, same character, same trap waiting to be set.
So I watched it instead of trading it.
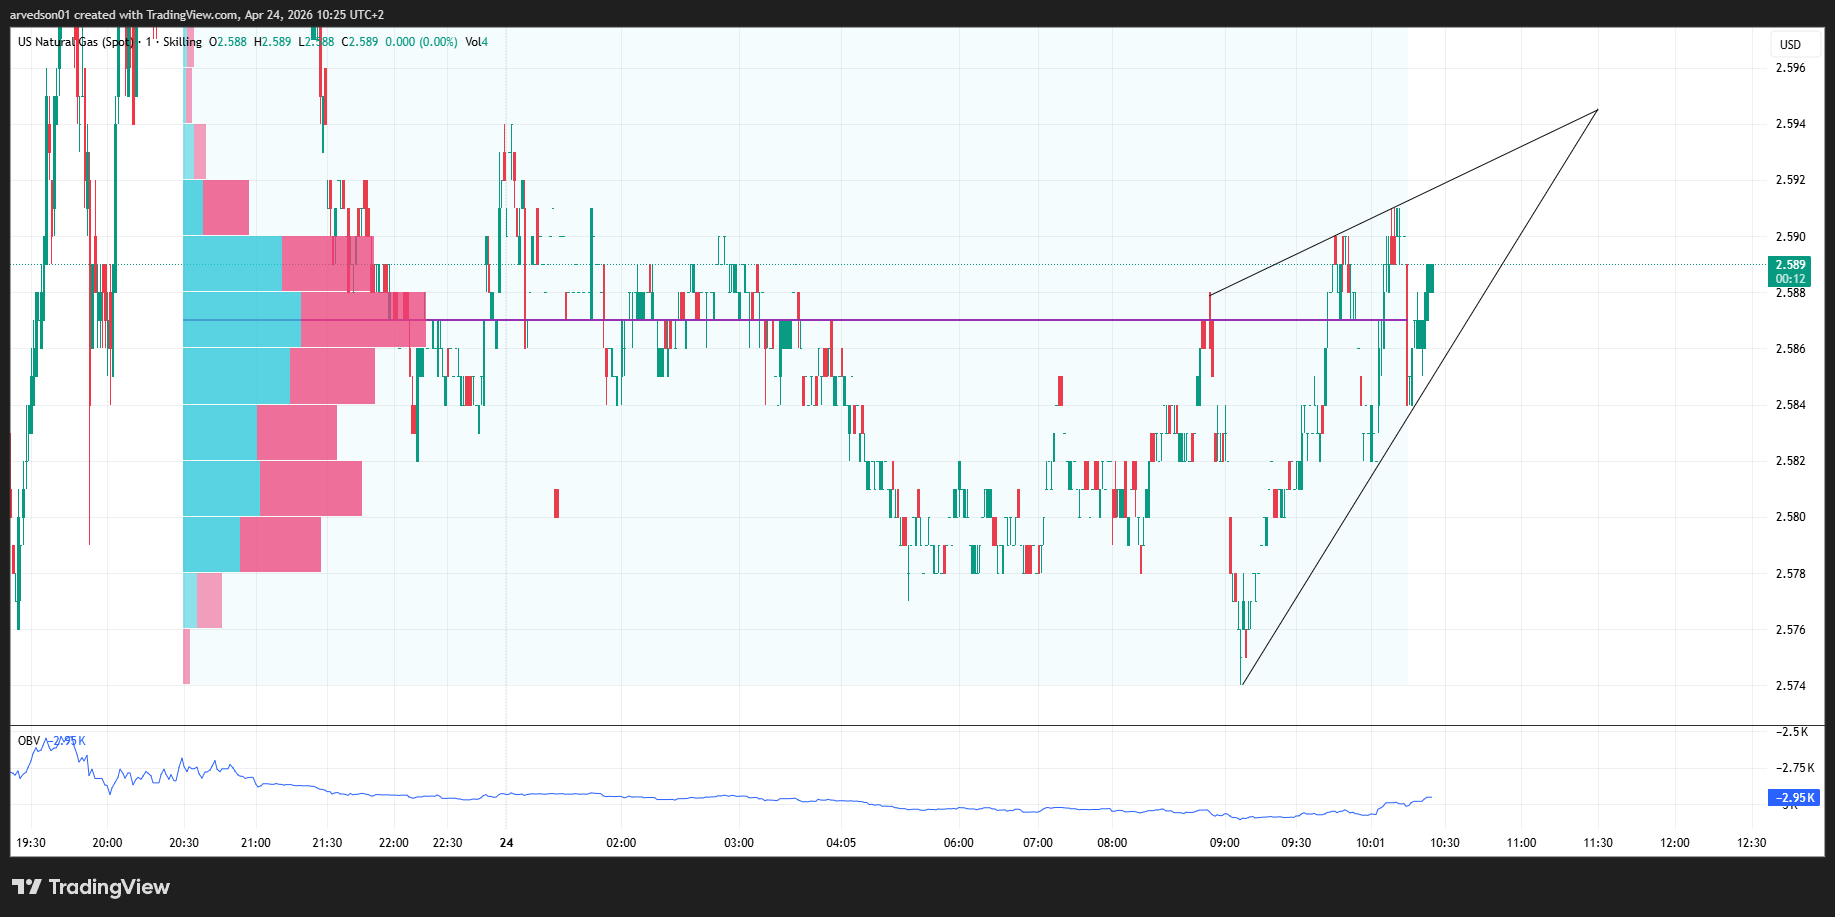
Natural gas has a nickname in the trading community: the widow maker. It has ended more accounts and broken more confidence than most instruments out there, and the name exists for a reason. It does not care about your conviction, your position size, or how well you read the daily chart. It will squeeze you up, flush you down, and do it again the following week with a completely straight face.
The 1-minute volume profile (the colored histogram on the left side of the chart, which shows where the most trading activity has been concentrated) had that purple line sitting above price, around $2.588, which in plain terms means there is a heavy cluster of previous transactions overhead, and price tends to struggle when it has to push through that kind of weight. Above your head is resistance. At your feet at a key level, it becomes support, and that shift in context changes the probability of the next move considerably. Not guaranteed, but enough to pay attention to.
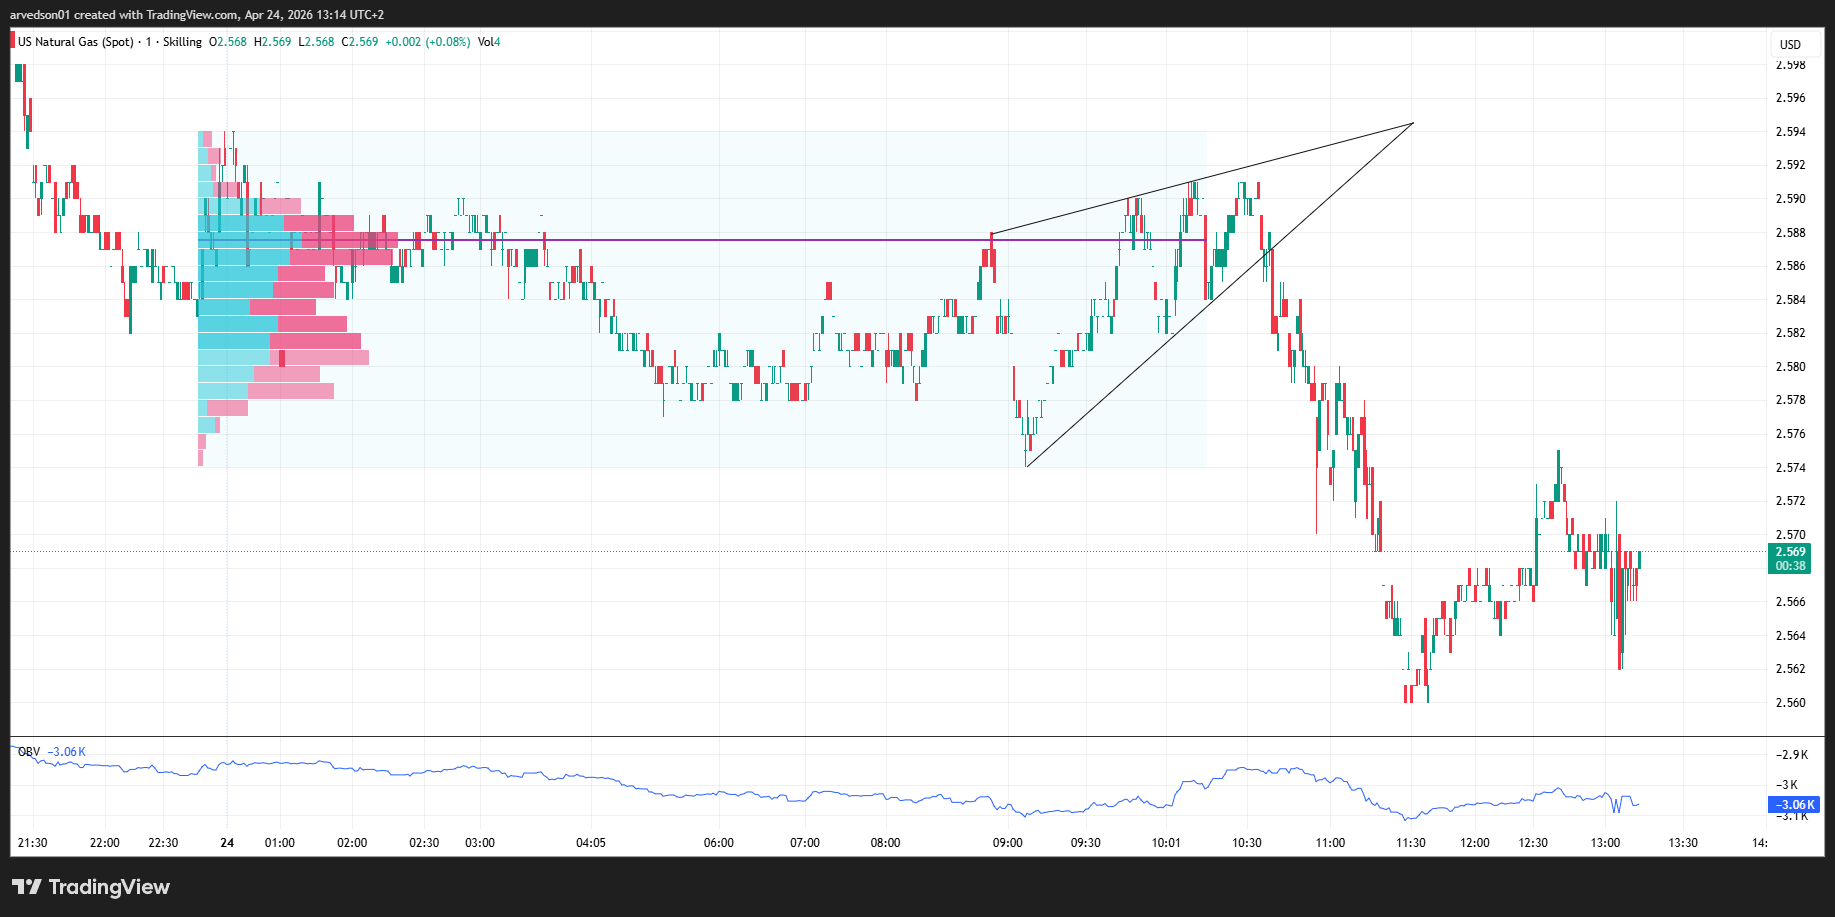
And then, as I finished writing, the wedge did exactly what wedges do. It broke to the downside. Patterns exist for a reason.
For now, I am staying away from natural gas. Not because the bigger picture is not interesting, it genuinely is, but because interesting and tradeable are two different things, and right now this market is rewarding patience more than participation.
Zoom out and the setup is actually compelling. Natural gas at $2.57 is cheap against the backdrop of what is happening in the world. We covered the Strait of Hormuz situation in a previous article, that narrow passage through which a significant portion of global energy supply moves, and the tension there has not gone away. Any escalation that disrupts those flows hits natural gas supply chains hard and fast, and the market is not pricing much of that risk right now. That could change quickly.
Keep it on your watchlist. Wait for the structure to clean up. And when the setup is ready, it will be obvious.
Until then, trade safe, manage your risk on every single position, and remember that staying in the game long enough is the only way to be there when the real move finally arrives. Risk management will not make you rich overnight, but it will keep you alive until the trade that does.
(If you want to know more about the Strait of Hormuz story, click this article bellow. )

See you in the next one, and yes, I will be writing about AMD. Corner seats reserved.
I am not a financial advisor. The analysis provided in this article is for informational and educational purposes only and does not constitute investment, financial, or legal advice. The scenarios, price targets, and projections mentioned are based on past market data, and are subject to change as market conditions evolve. Always perform your own due diligence and consult with a certified financial professional before making any investment decisions.
I really enjoyed this read. I also appreciate it because once upon a time, in a land far away, I tried investing. I stopped because I thought I understood investing, read reports and analysis, but always felt like I was missing something. I told myself, "I must not be smart enough to get this. Nobody else has the questions I do. They all get it. I don't. I shouldn't be swimming in this pool." The truth is, I am smart enough. Other people have questions, they just don't talk about them. I will keep reading. I may even dip a toe back into the pool. Thanks.